
Introduction
Wind tunnels are essential tools for investigating aerodynamic characteristics and evaluating the performance of airfoils, aircraft, and other engineering structures under controlled airflow conditions. They provide accurate measurements of aerodynamic forces such as lift and drag, which are important for aerodynamic design and validation.
Although Computational Fluid Dynamics (CFD) has become a widely used technique for aerodynamic analysis, experimental validation remains necessary to verify simulation accuracy. However, commercial wind tunnels are expensive, limiting their accessibility for educational and research purposes.
This study presents the design, CFD analysis, fabrication, and experimental validation of a low-cost open-circuit subsonic wind tunnel. The wind tunnel was designed using SolidWorks, and aerodynamic analysis of a NACA 0015 airfoil was performed using SolidWorks Flow Simulation. The prototype was fabricated using PVC sheet board and equipped with a load-cell-based force measurement system with a 2.8-inch TFT display for real-time drag and lift measurements. Finally, the experimental results were compared with CFD predictions to evaluate the performance and accuracy of the developed wind tunnel.
Methodology
The overall methodology adopted in this research consists of four major stages: design, numerical simulation, fabrication, and experimental validation.
Wind Tunnel Design
A low-cost open-circuit subsonic wind tunnel was designed using SolidWorks. The wind tunnel consists of an inlet section, contraction chamber, honeycomb flow straightener, test section, diffuser, and outlet fan. The contraction section was designed to accelerate the airflow before entering the transparent test section, while the honeycomb structure helps reduce turbulence and improves flow uniformity. A NACA 0015 airfoil was mounted at the center of the test section for aerodynamic force measurements.
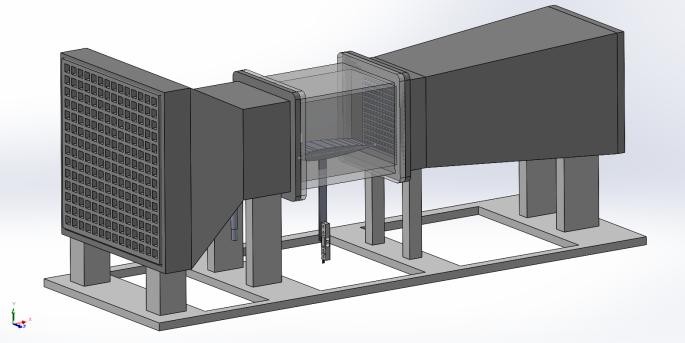
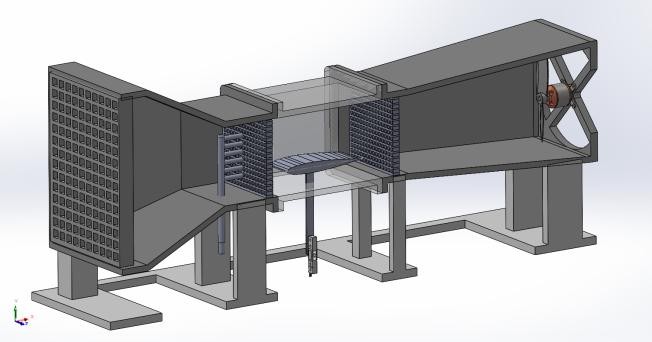
(Figure 1.1: SolidWorks CAD model of the wind tunnel)
CFD Simulation
The aerodynamic performance of the designed wind tunnel was investigated using SolidWorks Flow Simulation. An internal flow analysis was performed using air as the working fluid under standard atmospheric conditions. The airflow velocity at the inlet was specified as 10 m/s, while the outlet was assigned atmospheric pressure.
The NACA 0015 airfoil was placed at the center of the test section with an angle of attack of 0°. Global and surface goals were defined to obtain aerodynamic forces acting on the airfoil. The simulation continued until convergence was achieved, and the resulting pressure distribution, velocity contours, flow trajectories, lift force, and drag force were recorded.
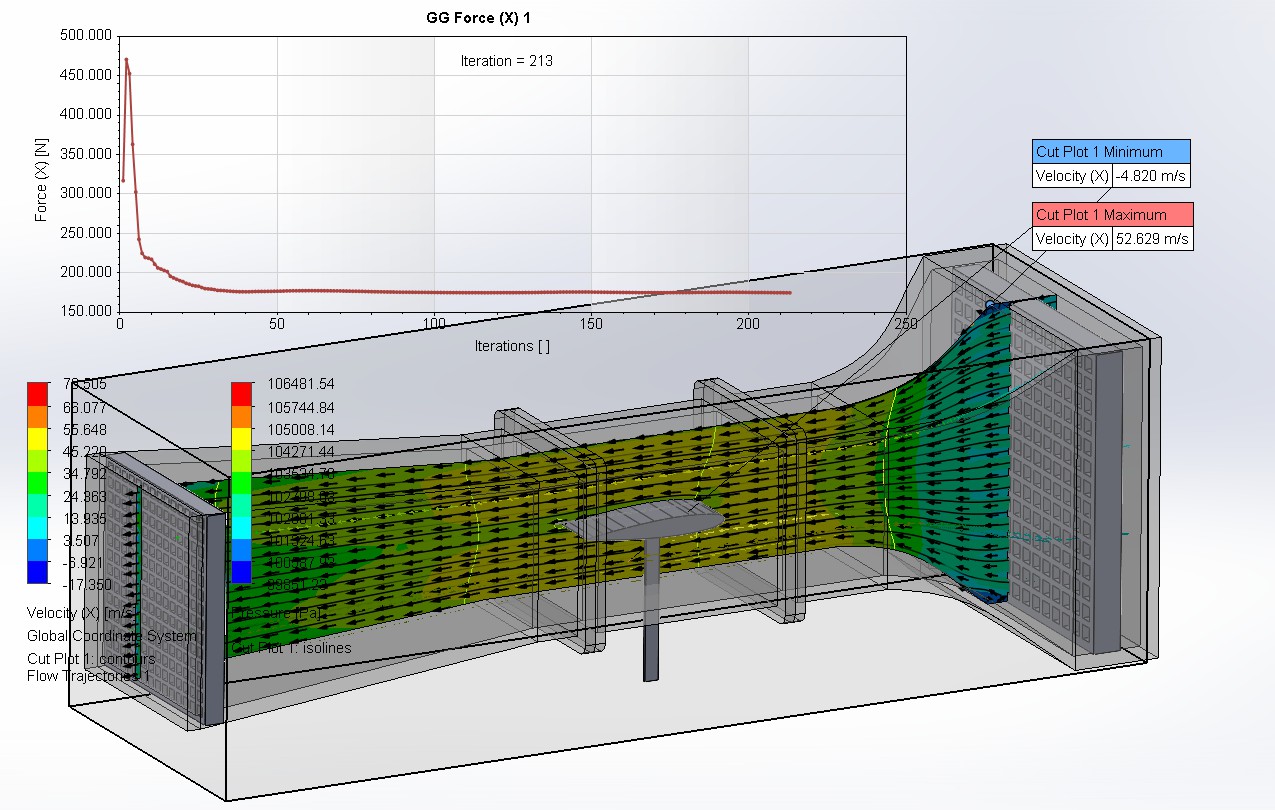
(Figure 1.2: Velocity contour of SolidWorks Flow Simulation)
Fabrication
After numerical validation, the wind tunnel was fabricated using white PVC sheet board with a transparent acrylic test section for airflow observation. A honeycomb flow straightener and diffuser were incorporated to improve airflow quality, and a NACA 0015 airfoil was mounted on a load-cell-based force measurement mechanism.
Table 1.1. Components Used for Fabrication and Instrumentation:
| Sl. No. | Component | Quantity | Function |
| 1 | White PVC Sheet Board | As required | Wind tunnel body fabrication |
| 2 | Acrylic Sheet | 1 | Transparent test section |
| 3 | NACA 0015 Airfoil | 1 | Aerodynamic test model |
| 4 | ESP32 Development Board | 2 | Control, data acquisition, and processing |
| 5 | Brushless DC (BLDC) Motor | 1 | Airflow generation |
| 6 | 30 A Electronic Speed Controller (ESC) | 1 | BLDC motor speed control |
| 7 | Load Cell | 1 | Aerodynamic force measurement |
| 8 | HX711 Amplifier Module | 1 | Load cell signal amplification and conversion |
| 9 | 2.8-inch TFT Display | 1 | Real-time display of measured forces |
| 10 | Honeycomb Flow Straightener | 1 | Reduces turbulence and straightens airflow |
| 11 | DC Power Supply | 1 | Powers the electronic components |
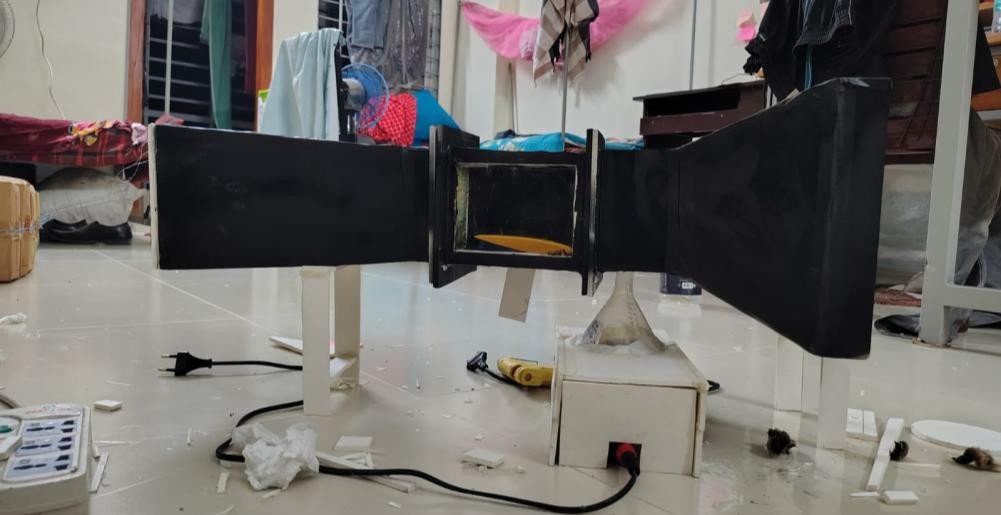
(Figure 1.3: Fabricated wind tunnel.)
Experimental Setup
A digital force measurement system was developed using a load cell, HX711 load cell amplifier, microcontroller, and a 2.8-inch TFT display. During operation, the airflow generated by the outlet fan passed through the contraction section and test section, producing aerodynamic forces on the airfoil. These forces were measured by the load cell and displayed in real time on the TFT display.
Multiple experimental measurements were recorded under identical operating conditions to improve measurement reliability.
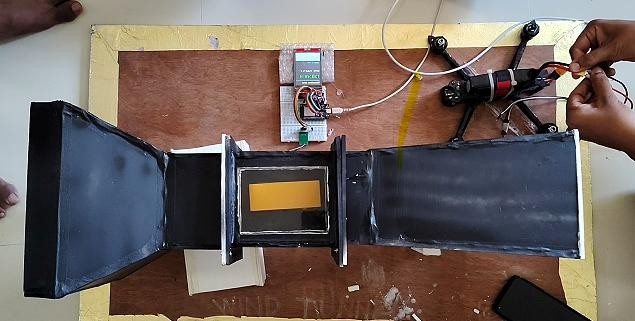
(Figure 1.4: Experimental setup)
Results
The aerodynamic performance of the developed wind tunnel was evaluated through both Computational Fluid Dynamics (CFD) simulation and experimental testing. SolidWorks Flow Simulation was used to predict the drag and lift forces acting on the NACA 0015 airfoil, while the fabricated wind tunnel measured the corresponding forces using a load-cell-based measurement system.
The CFD simulation converged after 13 iterations, indicating stable numerical results. The predicted drag force gradually decreased from 175.25 N to 174.82 N, while the lift force approached−0.04 N, which is expected for a symmetric NACA 0015 airfoil at a 0° angle of attack. The convergence history confirms the numerical stability of the simulation.
The fabricated wind tunnel was then tested under the same operating conditions. Thirteen experimental measurements were recorded using the load cell. The measured drag force ranged from 161.00 N to 170.12 N, with an average value of approximately 166.55 N. Similarly, the measured lift force varied between −0.49 N and −0.01 N, with an average value of approximately −0.24 N.
Table 1.2. Comparison of CFD and Experimental Results
| CFD Data Sets (Minimized) | Experimental | ||||
| Iterations | Drag | Lift | Trial | Drag (N) | Lift |
| 1 | 175.2460727 | -0.268824465 | 1 | 161 | -0.40862394 |
| 2 | 175.2225393 | -0.272782791 | 2 | 162.35 | -0.435867824 |
| 3 | 175.1699125 | -0.241093307 | 3 | 163.8 | -0.492646906 |
| 4 | 175.1905097 | -0.241863207 | 4 | 164.55 | -0.401488931 |
| 5 | 175.1194192 | -0.19790243 | 5 | 165.42 | -0.293917254 |
| 6 | 175.0975818 | -0.211033014 | 6 | 166.1 | -0.33146144 |
| 7 | 175.0625166 | -0.207697487 | 7 | 166.88 | -0.140838474 |
| 8 | 174.9997638 | -0.208231647 | 8 | 167.35 | -0.169672082 |
| 9 | 174.9335681 | -0.167847435 | 9 | 168.02 | -0.014031997 |
| 10 | 174.9496241 | -0.142282102 | 10 | 168.76 | -0.096957296 |
| 11 | 174.8892116 | -0.094828008 | 11 | 169.18 | -0.121470094 |
| 12 | 174.8163833 | -0.078611166 | 12 | 169.65 | -0.09113845 |
| 13 | 174.8150063 | -0.042259701 | 13 | 170.12 | -0.11678201 |
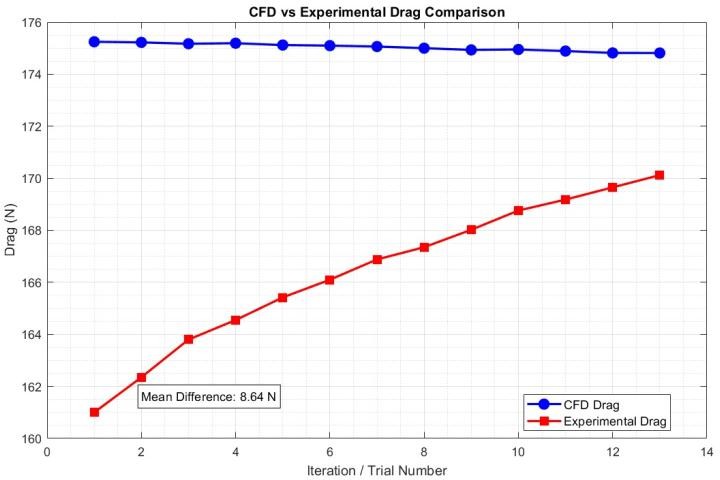
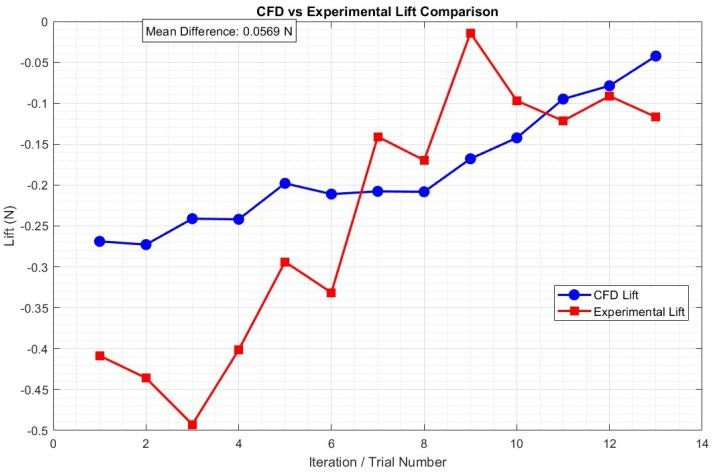
(Figure 1.5: CFD and Experimental convergence graph.
| Parameter | CFD | Experimental (Average) |
| Drag Force (N) | 174.82 | 166.55 |
| Lift Force (N) | −0.04 | −0.24 |
The experimental drag force closely followed the CFD prediction, with an average deviation of approximately 4.7%. This level of agreement indicates that the fabricated wind tunnel is capable of producing reliable aerodynamic measurements despite its low-cost construction. The slightly lower experimental drag values may be attributed to fabrication tolerances, minor air leakage, surface roughness of the PVC structure, non-uniform airflow generated by the BLDC fan, and measurement uncertainty of the load-cell system.
The lift force remained close to zero in both the CFD and experimental analyses because the NACA 0015 is a symmetric airfoil tested at zero angle of attack. Small negative lift values observed experimentally are likely caused by slight airfoil misalignment, mechanical vibration, sensor noise, and minor variations in airflow distribution inside the test section.
Overall, the close agreement between the numerical and experimental results demonstrates that the developed wind tunnel provides satisfactory aerodynamic performance and validates the applicability of SolidWorks Flow Simulation for predicting aerodynamic forces in low-speed wind tunnel experiments.
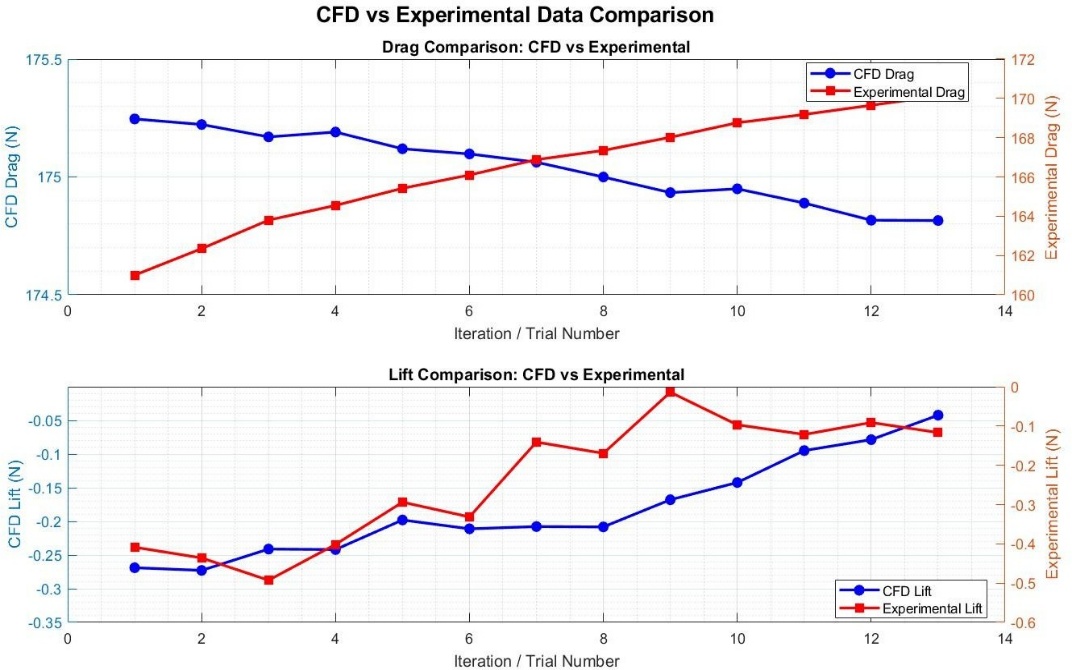
(Figure 1.6: Comparison of CFD and Experimental Drag Force.)
A low-cost open-circuit subsonic wind tunnel was successfully designed, simulated, fabricated, and experimentally validated for aerodynamic testing of a NACA 0015 airfoil. SolidWorks Flow Simulation predicted a drag force of 174.82 N and a lift force of −0.04 N, while the fabricated prototype measured an average drag force of 166.55 N and an average lift force of −0.24 N, corresponding to an approximate 4.7% deviation in drag. The close agreement between the CFD and experimental results demonstrates the reliability of the developed wind tunnel for low-cost aerodynamic studies. The proposed system is suitable for educational and undergraduate research applications, and future work will focus on testing different airfoil profiles, airflow velocities, and angles of attack.