
Experiment Name: Verification of Bernoulli’s Equation.
Abstract:
This experiment was conducted to verify Bernoulli’s equation using a Venturi meter. Water flow through the test section was measured at different points using manometer tubes and a collecting tank. The flow rate was calculated from collected water and time, while pressure heads were obtained from manometer readings. The mean total head values for three observations were approximately 296.36 mm, 250.09 mm, and 208.76 mm, showing that the total energy remained nearly constant, thus validating Bernoulli’s equation within experimental limits.
Introduction:
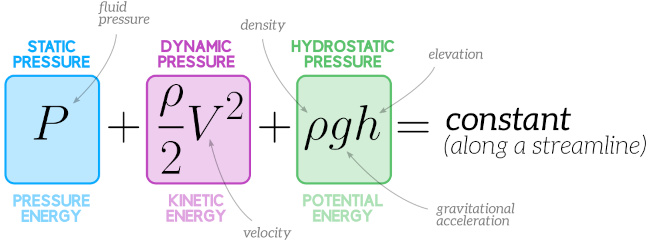
Bernoulli’s theorem is based on the principles of conservation of mass and conservation of energy. For a steady, incompressible, and frictionless fluid flow, the total mechanical energy of the fluid remains constant along a streamline. This means that the energy at the inlet of a control volume is equal to the energy at the outlet, provided that no energy is lost due to friction or other effects.
Mathematically, Bernoulli’s equation between two points on the same streamline can be expressed as:where and denote the pressure, velocity, and elevation of the fluid at point 1, while and denote the corresponding values at point 2, as shown in Figure 1. Although the equation is written for two specific points, Bernoulli’s equation is valid for any two points along a given streamline.
In this experiment, Bernoulli’s equation is verified using a Venturi meter by measuring pressure and velocity variations at different sections of the pipe. The experimental observations are then compared with theoretical expectations to examine the validity of Bernoulli’s principle under practical flow conditions.
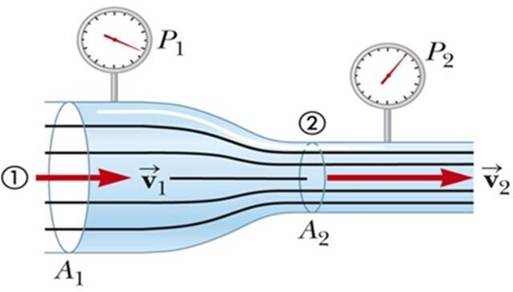
Figure 1. Two points in a streamline of flowing fluid.
Objectives:
- To understand the basic principle of Bernoulli’s equation.
- To verify Bernoulli’s equation experimentally.
- To study pressure variation along a flowing fluid.
- To analyze the effect of velocity on pressure.
- To observe conservation of energy in fluid flow.
Required Apparatus:
- Venturi tube.
- Manometer tubes.
- Water supply system.
- Flow control valve.
- Stopwatch.
- Measuring cylinder.
- Scale or ruler.
- Collecting tank (reservoir).
Methodology:
The experiment was conducted under steady flow conditions using a Venturi meter. Water was supplied through the Venturi tube, and pressure heads at different sections were measured with manometer tubes. The discharge was obtained by collecting water for a measured time. Using the recorded data, velocity and total head were calculated and compared to verify Bernoulli’s equation.
Experimental Setup:
The experimental setup consists of a Venturi meter test rig connected to a constant water supply system, as shown in Figure 2. Water flows through the Venturi tube under controlled conditions, producing variations in velocity and pressure along the flow path. The major components of the setup and their functions are described below:
- Venturi tube: Provides varying cross-sectional areas to create changes in flow, velocity and pressure.
- Manometer tubes: Measures the pressure head at different sections of the Venturi tube.
- Flow control valve: Regulates the discharge and maintains steady flow conditions.
- Water supply system: Supplies water at a constant head to the Venturi meter.
- Collecting tank: Collects the discharged water for flow rate measurement.
- Stopwatch: Measures the time required to collect a known volume of water.
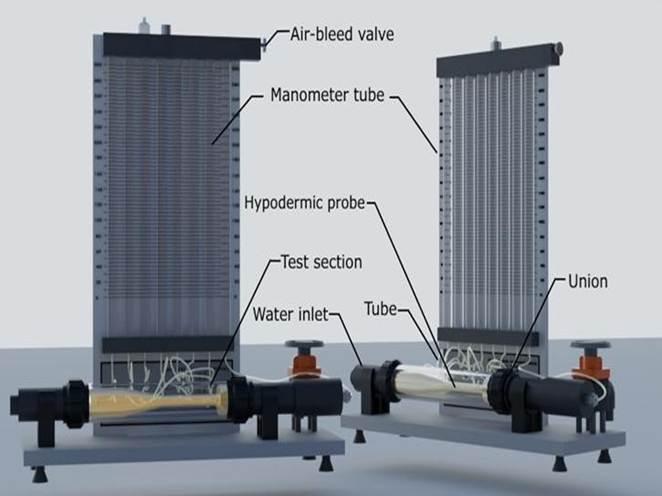
Figure 2. Experimental setup of Verification of Bernoulli’s Equation.
Procedure:
- The water pump was started, and the manometer tubes were filled with water ensuring no air bubbles were present.
- The flow control valve was slowly opened to allow steady flow through the Venturi tube.
- Manometer readings at different pressure tapping points were recorded after the flow became stable.
- Water discharged from the Venturi was collected in the measuring tank for a known time using a stopwatch.
- The collected water volume and time were recorded to calculate the flow rate.
- The procedure was repeated for different flow conditions to obtain multiple observations.
Data Analysis:
Constants
Diameter of inlet pipe,
Diameter of Venturi throat,
Area of inlet section,Area of throat section,Acceleration due to gravity,Equations Used
Experimental flow rate,
Theoretical flow rate,
Coefficient of discharge,
Velocity,
Velocity head,
Piezometer head,
Total head,
Where:
= Volume of collected water (L)
= Time of collection (s)
= Cross-sectional area (m²)
= Piezometer reading
= Elevation head = 0
The collected data are given in Table 1 and Table 2.
Table 1 presents the collected experimental data used to calculate the flow rate, theoretical discharge, and coefficient of discharge for different observations.
Table 2 shows the measured and calculated values of pressure head, velocity head, and total head at different tube positions to verify Bernoulli’s equation.
Table 1. Collected data table for calculating flow rate.
Table 1. Collected data table for calculating flow rate.
| No. of Obs. | Volume of collected water, W (L) | Time of collection of water, T (s) | Experimental flow rates, | Theoretical flow rates, (×10⁻⁴) | Coefficient of discharge, |
| 1 | 1 | 6.80 | 1.47 | 1.429 | 1.03 |
| 2 | 7.92 | 1.26 | 1.193 | 1.06 | |
| 3 | 9.61 | 1.04 | 1.025 | 1.01 |
Table 2. Collected data table for calculating total head.
| No of Obs. | Tube Position | Diameter (mm) | Cross-Sectional Area, A (m2) | Piezometer Reading, | Velocity, | Velocity Head, | Piezometer Head, | Total Head, | Mean Head (m) |
| 1 | a | 25.0 | 4.91 | 280 | 0.299 | 4.56 | 280 | 284.56 | 296.2567 |
| b | 14.6 | 1.67 | 247 | 0.880 | 39.47 | 247 | 286.47 | ||
| c | 12.4 | 1.21 | 214 | 1.214 | 75.12 | 214 | 289.12 | ||
| d | 11.3 | 1.00 | 185 | 1.470 | 110.14 | 185 | 295.14 | ||
| e | 10.6 | 0.88 | 156 | 1.670 | 142.15 | 156 | 298.15 | ||
| f | 10.0 | 0.78 | 143 | 1.885 | 181.10 | 143 | 324.10 | ||
| 2 | a | 25.0 | 4.91 | 235 | 0.257 | 3.37 | 235 | 238.37 | 250.9933 |
| b | 14.6 | 1.67 | 212 | 0.754 | 28.98 | 212 | 240.98 | ||
| c | 12.4 | 1.21 | 191 | 1.041 | 55.23 | 191 | 246.23 | ||
| d | 11.3 | 1.00 | 171 | 1.260 | 80.92 | 171 | 251.92 | ||
| e | 10.6 | 0.88 | 151 | 1.432 | 104.52 | 151 | 255.52 | ||
| f | 10.0 | 0.78 | 140 | 1.615 | 132.94 | 140 | 272.94 | ||
| 3 | a | 25.0 | 4.91 | 202 | 0.212 | 2.29 | 202 | 204.29 | 208.7633 |
| b | 14.6 | 1.67 | 185 | 0.623 | 19.78 | 185 | 204.78 | ||
| c | 12.4 | 1.21 | 170 | 0.859 | 37.61 | 170 | 207.61 | ||
| d | 11.3 | 1.00 | 155 | 1.040 | 55.13 | 155 | 210.13 | ||
| e | 10.6 | 0.88 | 140 | 1.182 | 71.21 | 140 | 211.21 | ||
| f | 10.0 | 0.78 | 124 | 1.333 | 90.56 | 124 | 214.56 |
Table 2. Collected data table for calculating total head.
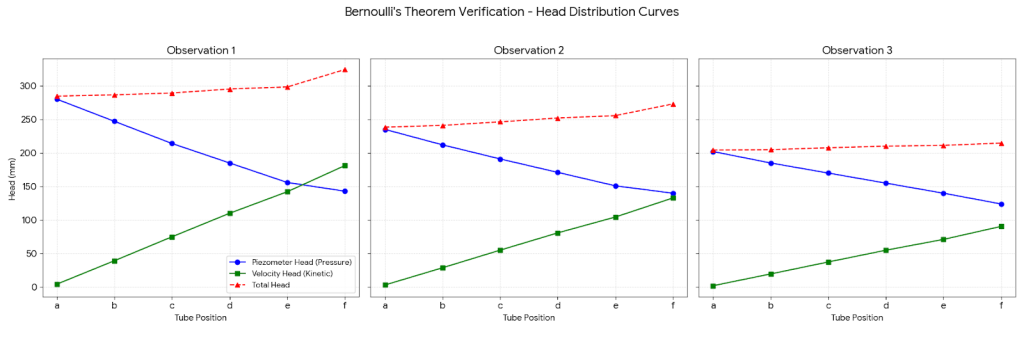
A graph was plotted to verify Bernoulli’s Theorem, illustrating energy changes along the flow. As the pressure head drops, the velocity head rises, demonstrating the conversion of potential energy into kinetic energy. The total head line remains relatively flat, confirming the conservation of total energy within the system.
Result Summary:
Tables 1 and 2 present the experimental flow rates and the calculated head components at different sections of the Venturi tube. The collection time for 1L water increased as the experimental flow rates decreased from 1.47×10⁻⁴ m³/s to 1.04×10⁻⁴ m³/s. The calculated total head values for the three observations were approximately 296.36×10⁻³ m, 250.09×10⁻³ m, and 208.76×10⁻³ m respectively. The distribution of pressure head and velocity head along the tube shows that pressure decreases with increasing velocity, while the total head remains nearly constant, supporting Bernoulli’s principle.
Discussion:
The experimental results show good agreement with Bernoulli’s equation. As expected, the velocity increased at the throat section of the Venturi tube, resulting in a corresponding decrease in pressure head. Despite these variations, the total head at different sections for each observation remained nearly constant. Minor deviations were observed between theoretical and experimental values, which may be attributed to frictional losses, manometer reading errors, and slight flow unsteadiness. Additionally, assumptions such as frictionless flow and perfectly steady conditions are difficult to achieve in practice. However, the overall trend of energy conservation along the streamline closely matches theoretical predictions.
Conclusion:
The objectives of the experiment were successfully achieved. Bernoulli’s equation was verified experimentally using a Venturi meter by analyzing pressure and velocity variations along the flow. The results demonstrate that an increase in velocity corresponds to a decrease in pressure and that the total head remains approximately constant along the streamline. Although small experimental errors were present, the close agreement between theoretical and experimental results confirms the validity of Bernoulli’s principle under practical flow conditions.
Appendix:
Sample Calculation
Volume of collected water,
Time of collection,
Cross-sectional area at position a,Piezometer reading,
- Experimental Flow Rate
- Velocity at Tube Position a
- Velocity Head
- Piezometer Head
(Since the tube is horizontal, )
- Total Head
- Theoretical Discharge
- Coefficient of Discharge


