
ABSTRACT
A small-scale model (length 1710 mm) of a General Motors SUV was built and tested in a wind tunnel for expected wind conditions and road clearance. Two passive devices—a rear screen, which is a plate behind the car, and a rear fairing, where the end of the car is aerodynamically extended—were incorporated in the model and tested in the wind tunnel under different wind conditions. The results show that the rear screen could reduce drag by up to 6.5%, while the rear fairing can reduce drag by 26%. Additional tests were conducted for front edging and rear vortex generators; however, the results for drag reduction were mixed. It should be noted that aesthetic and practical considerations may allow only partial implementation of these or any drag reduction options.
INTRODUCTION
The issue of reducing vehicle power consumption emerged nearly at the same time the vehicle itself was invented. In the early days, fueling stations were few, and low-consumption vehicles were required to cover the longest possible distance between refueling. As the number of vehicles increased and fuel costs rose, reducing fuel consumption again became important—not only to save fuel but also to protect the environment.
Vehicle power consumption can be reduced through various methods, such as improving engine efficiency and reducing aerodynamic drag. From the earliest days of vehicle design, engineers recognized the importance of drag reduction and attempted to streamline vehicle shapes. Since the early 20th century, a large number of studies have been carried out in this field, some of which are listed in references [1–6]. During this period, the basic principles of vehicle body optimization and the definition of the lower limit of aerodynamic drag were established. For a perfectly optimized car body configuration, the lowest possible aerodynamic drag coefficient is approximately 0.16.
Simulating road conditions in wind tunnel testing has a significant effect on drag measurements [4], and it has been concluded that the use of a smooth, immovable ground screen provides reliable results for comparative testing. The rear part of a vehicle contributes significantly to the total aerodynamic drag, and various rear-end configurations have been studied extensively [5]. An interesting study [6] examined the effect of variations in the front and rear sections of a minibus on the total drag coefficient. Additionally, a comprehensive publication [3] evaluates different designs of vortex generators.
Vehicles operate under a wide range of speeds, airflow rates and directions, and road conditions. No single streamlined body shape can minimize drag under all operating conditions. Therefore, there is a need to develop passive devices that maintain a low drag coefficient over a wide range of conditions, or active methods that can dynamically change the vehicle configuration to suit different speeds.
INVESTIGATION METHOD
There are various passive-device approaches used to reduce aerodynamic drag, including:
- front screens;
- rear screens;
- structural elements that localize the area of flow detachment (edging);
- vortex airflow generators;
- deflectors located over the rear part of the vehicle roof;
- four-element rear fairing and its components;
- front fairing.
A two-pronged study was undertaken using Computational Fluid Dynamics (CFD) analysis and wind tunnel testing of large-scale models under simulated conditions. This paper presents the results of wind tunnel investigations of a vehicle model equipped with various passive drag-reduction devices.
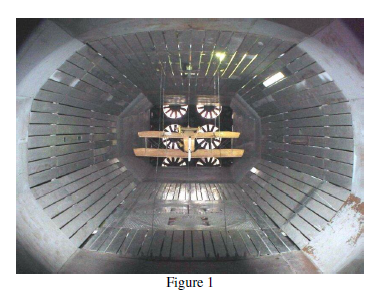
The experiments were conducted in the TAD-2 wind tunnel at the National Aviation University of Ukraine (NAU). The wind tunnel has the following main characteristics:
- maximum airspeed in the working section without a model installed is 42 m/s;
- initial turbulence intensity of the airflow in the working section without a model, measured using the ball method, is 0.9%;
- length of the working section is 5.5 m;
- overall dimensions of the octagonal working-section cross-section are 4.0 m in width and 2.5 m in height, as shown in Figure 1.
During testing, it is possible to measure the total vector of aerodynamic forces and moments acting on the model, as well as the pressure distribution over the model surface. The TAD-2 wind tunnel was commissioned in 1979 and has been used extensively for Ukrainian aviation and space rocketry research.
INVESTIGATION TASKS AND PURPOSE
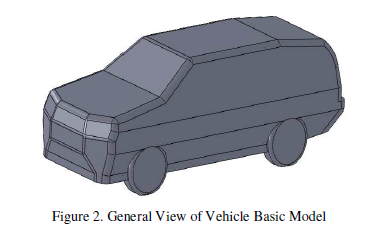
The vehicle model tested in this study is shown in Figure 2. The model has a total length of L = 1710 mm.
Figure 2. General view of the vehicle basic model
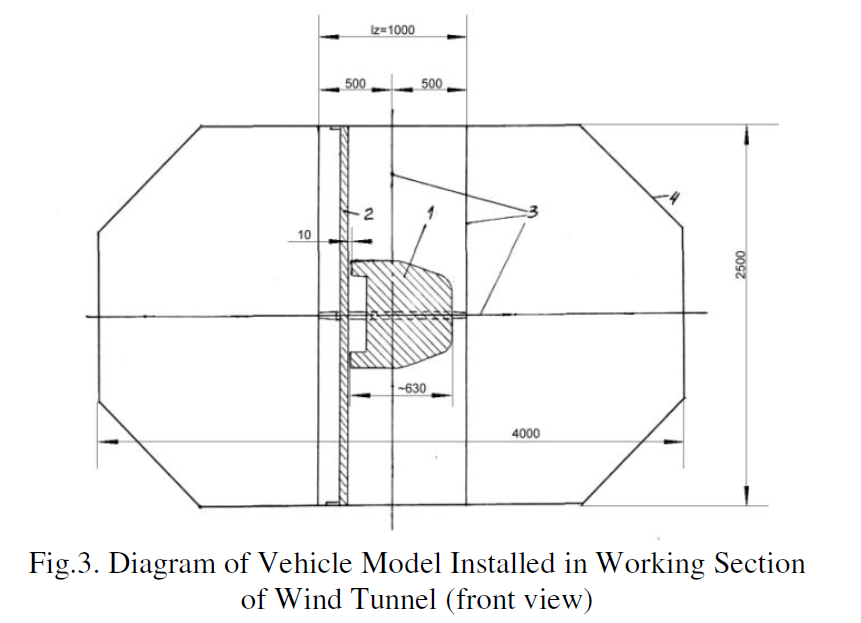
A schematic representation of the model installed in the wind tunnel is shown in Figure 3.
Figure 3. Diagram of vehicle model installed in the working section of the wind tunnel (front view)
(1 – vehicle model;
2 – vertical road-simulating screen;
3 – suspension link of six-component electrotensometry balance;
4 – contour of the cross-section of the wind tunnel working section)
Preliminary tests conducted using various passive drag-reduction devices indicated that significant drag reduction was achieved using two configurations: the rear screen and the rear fairing. Therefore, this paper primarily discusses the experimental results obtained for these two options.
In addition, the paper presents preliminary results for two other passive drag-reduction methods: a structural element installed at the front of the model and a vortex generator placed on the upper rear section of the model.
The main results are presented in a comparative form (percentage values), as the base drag coefficient varied due to uncertainties in the test setup. For each device tested, the drag coefficient of the base model was first measured. Subsequently, the passive device was installed, and the new drag coefficient was determined and compared with the base case.
SETTING OF TASK TO TEST A MODEL WITH REAR SCREEN
The rear screen is a flat plate installed at the rear of the vehicle, as shown in Figures 4–6.
Figure 4. Vehicle rear part with rear screen
Figure 5. Side view of rear screen
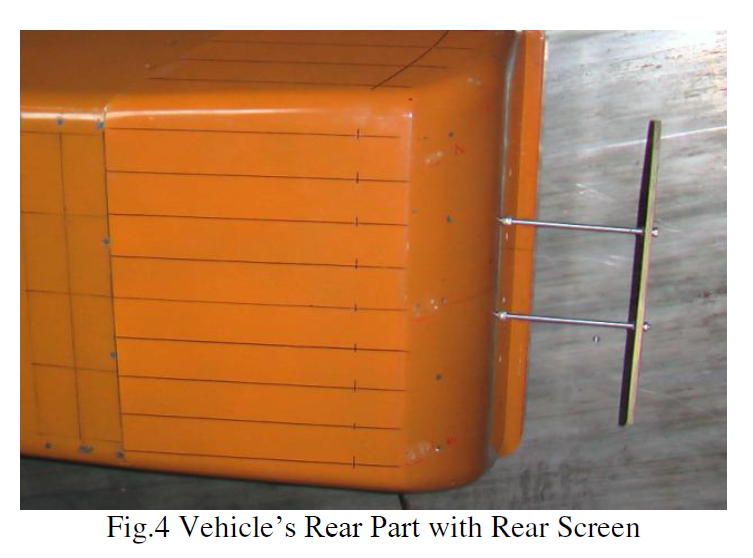
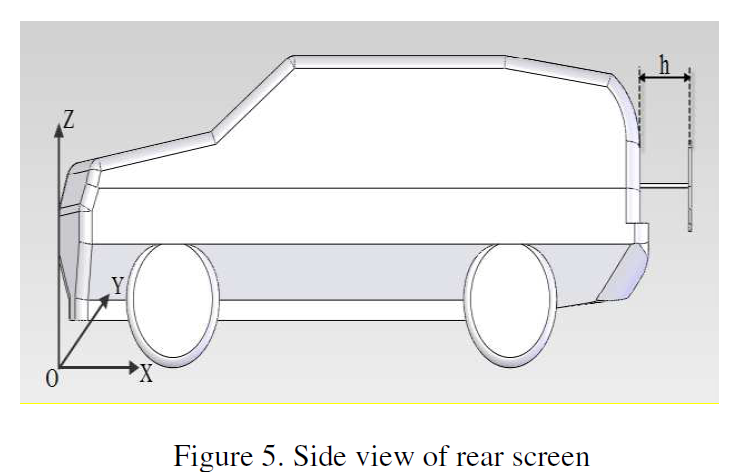
Figure 6. Rear view of rear screen
The expected aerodynamic drag reduction is achieved due to the formation of a vortex between the rear wall of the vehicle model and the rear screen. This vortex enables a no-separation flow of the external air stream. As a result, the wake width is reduced, leading to a decrease in base drag due to an increase in base pressure.
The rear screens were installed at various distances h from the model surface. The screen contour followed the rear-view contour of the vehicle model with scale factors D = 0.6 and D = 0.8, and the screen thickness was 7.5 mm. Tests were also conducted using screens with a thickness of 1 mm and similar rear-contour scale sizes (D = 0.8 and D = 0.6).
The effect of using two rear screens installed sequentially was also investigated. The distance between the model rear wall and the first screen was denoted as h₁, and the distance between the two screens was denoted as h₂.
RESULTS OF TESTS OF MODEL WITH REAR SCREEN
To eliminate experimental error caused by possible inaccuracies in aligning the model with the airflow velocity vector, tests were performed for various incident angles β. The minimum value of any function with respect to β corresponds to the vehicle’s head-on flow condition without a sideslip angle, which can occur under real driving conditions.
In all tested configurations, the use of rear screens resulted in a reduction of the aerodynamic drag of the vehicle model. Among the investigated cases, the most effective configuration involved screen scale factors D = 0.6 and D = 0.8, resulting in a drag reduction ranging from 5.5% to 6.5%, as shown in Figure 7.
Table 1 indicates that there exists an optimum gap value that yields the minimum drag coefficient.
Visual observations revealed the formation of a vortex in the clearance between the rear screen and the rear wall of the model, at least in the upper region. On the side surfaces, flow separation was observed immediately behind the model. It is worth noting that for this particular vehicle configuration, it was not possible to form a stable oval vortex in the clearance between the screen and the rear wall, which could potentially result in further drag reduction. Preliminary CFD calculations also indicated increased pressure behind the screen, contributing to an additional reduction in the opposing aerodynamic force.
Figure 7. Effect of rear screen on aerodynamic drag coefficient Cₓ
Table 1. Effect of gap on drag coefficient for rear screen (D = 0.6)
| h (mm) | Cₓ(min) |
|---|---|
| 224 | 0.378 |
| 200 | 0.378 |
| 158 | 0.387 |
| 100 | 0.392 |
| Without rear screen (base drag coefficient) | 0.402 |
SETTING OF TASK TO TEST MODEL WITH REAR FAIRING
The second investigated method for aerodynamic drag reduction, known as the rear fairing, involves installing a structure at the rear part of the vehicle within the flow separation region. In the ideal case, this structure enables a no-separation flow around the modified vehicle configuration, as shown in Figure 8.
The results of these investigations are useful for analyzing the fundamental means of aerodynamic drag reduction and for estimating the minimum achievable drag values. These results are primarily of academic significance. Another objective of the tests was to establish an experimental database for validating design methodologies and for analyzing the feasibility of simulating separated flow during vehicle design.
Figure 8. Vehicle model with four-section rear fairing
Several configurations of rear fairings with different lengths were investigated. These configurations are schematically shown in Figure 9.
Figure 9. Geometry of rear fairing
RESULTS OF TESTS OF MODEL WITH REAR FAIRING
The results of aerodynamic drag coefficient measurements are presented in Figure 10.
(β₀ vs Cₓ plot)
- model without tail units
- model with 1 tail unit
- model with 2 tail units
- model with 3 tail units
- model with 4 tail units
- front streamlined shape
Figure 10. Dependence of aerodynamic drag coefficient on sideslip angle
(Base drag coefficient Cₓ = 0.415)
The conducted series of tests made it possible to analyze various drag-reduction approaches commonly used in aviation engineering. For example, aircraft tail components such as fuselages, nacelles, landing gear housings, and suspension elements are often equipped with rear fairings to reduce aerodynamic drag.
The use of an idealized aft rear fairing for the vehicle model under consideration demonstrated high aerodynamic efficiency. When a full-length rear fairing was installed, the head-on aerodynamic drag coefficient of the vehicle model decreased by 26%. A half-length truncated rear fairing also showed high efficiency, reducing the drag coefficient by 22.6%. When the aft rear fairing length was reduced to 25% of the full length, the drag coefficient of the vehicle model was reduced by 16.1%.
ADDITIONAL CONCEPTS
Additional passive devices were tested to further reduce aerodynamic drag.
Structural elements designed to localize the flow separation area (edging), shown in Figures 9 and 10, were installed on the front part of the vehicle model. These elements are intended to create low-pressure return zones at the vehicle edges, as illustrated in Figure 11. Similar investigations were reported in [9].
Figure 9. Structural elements that localize the area of flow detachment (circular edging)
Figure 10. Structural elements that localize the area of flow detachment (upper and lower edging only)
Figure 11. Schematic representation of flow with edging
During testing, the distance b between the edging and the front edge of the vehicle model, as well as the edging height h, were varied. The height h ranged from 15 mm to 25 mm, while the distance b varied from 30 mm to 60 mm. Two edging configurations were examined:
- a ring-shaped edging mounted at the front of the vehicle (Figure 9),
- upper and lower edging elements mounted at the front of the vehicle (Figure 10).
The test results corresponding to optimal values of h and b are presented in Table 2.
Table 2. Effect of gap on drag coefficient for structural elements localizing flow separation
| Structural element configuration | ΔC̄ₓ (%) | Base drag coefficient Cₓ |
|---|---|---|
| Upper and lower edging, distance 30 mm, height 25 mm | −2.24 | 0.392 |
| Ring edging, height 15 mm, distance 60 mm | +1.74 | 0.392 |
Investigations were also conducted on vortex airflow generators installed on the rear edge of the vehicle roof. Three vortex generator configurations were tested, as shown in Figure 12. In this approach, the net change in drag coefficient is the result of a balance between the increased drag caused by the device itself and the reduction in drag due to delayed flow separation.
For VG1, the distance from the rear edge of the vehicle was varied from 36 mm to 60 mm, the height from 12 mm to 25 mm, and the installation angle from 15° to 18°. Seven vortex generators were used.
For VG2, the number of vortex-generating elements varied from 24 to 30 (Figure 13). The distance from the rear edge was 30 mm, and the height of the elements was 10 mm.
For VG3, the number of vortex-generating elements varied from 16 to 24 (Figure 14).
VG1 VG2 VG3
Figure 12. Types of vortex generators
Figure 13. VG2 vortex generators
Figure 14. VG3 vortex generators
The test results for the most effective geometric configurations are summarized in Table 3.
Table 3. Effect of vortex generator orientation on drag coefficient
| Type of vortex generator | ΔC̄ₓ (%) | Base drag coefficient Cₓ |
|---|---|---|
| VG1: Roof-mounted, rear position, 36 mm from edge, 7 elements, spacing 70 mm, γ = 15°, h = 20 mm | +0.25 | 0.392 |
| VG2: Prism-shaped, roof-mounted, rear position, 36 mm from edge, 30 elements, γ = 0° | −1.24 | 0.392 |
| VG3: Clark-profile vortex generators, 8 elements on each side guiding flow toward center | −0.26 | 0.389 |
The tests involving structural flow-localizing elements and vortex airflow generators did not yield a significant positive effect on aerodynamic drag reduction and require further analysis.
CONCLUSIONS
- The use of a rear screen allows a reduction in aerodynamic drag of the investigated vehicle model by up to approximately 6.5%. The effectiveness of rear screens depends on their configuration, dimensions, and placement, as well as on the geometry of the vehicle’s rear section. External mounting of a spare tire may also be arranged to reduce drag.
- Rear fairing installed within the flow separation region behind the vehicle can reduce aerodynamic drag by up to 26% for the investigated configuration. These results are useful for validating calculation methods for vehicles with separated flow regions and may assist designers and engineers in selecting external vehicle configurations.
- Other passive drag-reduction options also show potential. Front structural elements achieved drag reductions of up to 2.24%, while vortex generators achieved reductions of up to 1.24%. Further improvements are possible with better understanding of the flow field and optimized design.
ACKNOWLEDGEMENT
The authors would like to thank Bahram Khalighi (General Motors Global R&D, Vehicle Department Research Laboratory, USA) and Alexey Ushakov (Chief Scientist for Eastern Europe, GM R&D Office) for their assistance and guidance throughout this research. This investigation was conducted under the Department of Energy program of the Global Initiative for Proliferation Prevention (Grant BNL-T2-370-UA).